ww.kaggle.com/janiobachmann/credit-fraud-dealing-with-imbalanced-datasets
Credit Fraud || Dealing with Imbalanced Datasets
Explore and run machine learning code with Kaggle Notebooks | Using data from Credit Card Fraud Detection
www.kaggle.com
I. 데이터 살펴보기
1) 데이터에 대한 이해
II. 전처리
1) 스케일링
2) 데이터 나누기
III. 랜덤 언더샘플링과 오버샘플링
1) 상관관계
2) 이상치 확인 및 제거
3) 차원축소와 군집화 (t-SNE)
4) 분류기
5) 로지스틱 회귀 깊이 알아보기
6) SMOTE를 사용한 오버샘플링
IV. 검증(Testing)
1) 로지스틱 회귀모형으로 검증(Test)
2) 신경망으로 검증 (언더샘플링과 오버샘플링 비교)
이번엔 3-5) 로지스틱 회귀 깊이 알아보기 부터 시작한다.
이전 포스팅: Credit Card Fraud Detection 연습 (1)
3-5. 로지스틱 회귀에 대해 깊이 알아보기
TP, FP, TN, FN, Precision, Recall에 대한 공부가 선행되어 있으면 이해가 수월할 것이다.
로지스틱 회귀 모형에 대한 ROC 곡선 그리기
#로지스틱 회귀 모형 ROC 곡선 그리기

def logistic_roc_curve(log_fpr, log_tpr):
    plt.figure(figsize = (12, 8))
    plt.title('Logistic Regression ROC Curve', fontsize = 16)
    plt.plot(log_fpr, log_tpr, 'b-', linewidth = 2)
    plt.plot([0, 1], [0, 1], 'r--')
    plt.xlabel('False Positive Rate', fontsize = 16)
    plt.ylabel('True Positive Rate', fontsize = 16)
    plt.axis([-0.01, 1, 0, 1])

logistic_roc_curve(log_fpr, log_tpr)
plt.show()
제법 좋은 곡선이 그려졌다.
오리지널 데이터와 언더샘플링 데이터 비교
#정밀도-재현율 곡선

from sklearn.metrics import precision_recall_curve

precision, recall, threshold = precision_recall_curve(y_train, log_reg_pred)

from sklearn.metrics import recall_score, precision_score, f1_score, accuracy_score
y_pred = log_reg.predict(X_train)

#오리지널 데이터를 사용한다면 얼마나 과적합 되는지 확인

print('---' * 45)
print('Overfitting: \n')
print('Recall Score: {:.2f}'.format(recall_score(y_train, y_pred)))
print('Precision Score: {:.2f}'.format(precision_score(y_train, y_pred)))
print('F1 Score: {:.2f}'.format(f1_score(y_train, y_pred)))
print('Accuracy Score: {:.2f}'.format(accuracy_score(y_train, y_pred)))
print('---' * 45)

#언더샘플링 데이터로 확인했을 때

print('---' * 45)
print('How it should be:\n')
print("Accuracy Score: {:.2f}".format(np.mean(undersample_accuracy)))
print("Precision Score: {:.2f}".format(np.mean(undersample_precision)))
print("Recall Score: {:.2f}".format(np.mean(undersample_recall)))
print("F1 Score: {:.2f}".format(np.mean(undersample_f1)))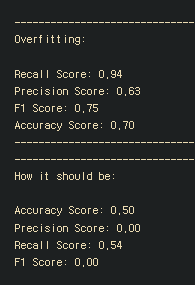
오리지널 데이터에 적용한 Precision-recall 점수 계산
#오리지널 데이터에 적용한 precision-recall 점수

undersample_y_score = log_reg.decision_function(original_Xtest)

from sklearn.metrics import average_precision_score

undersample_average_precision = average_precision_score(original_ytest, undersample_y_score)

print('Average precision-recall score: {0:0.2f}'.format(undersample_average_precision))
Precision-Recall 곡선 그리기
#Precision-Recall 곡선 그리기

from sklearn.metrics import precision_recall_curve

fig = plt.figure(figsize = (12, 6))

precision, recall, _ = precision_recall_curve(original_ytest, undersample_y_score)

plt.step(recall, precision, color = '#004a93', alpha = 0.2, where = 'post')
plt.fill_between(recall, precision, step = 'post', alpha = 0.2, color = '#48a6ff')
plt.xlabel('Recall')
plt.ylabel('Precision')
plt.ylim([0.0, 1.05])
plt.xlim([0.0, 1.0])
plt.title('UnderSampling Precision-Recall curve: \n Average Precision-Recall Score ={0:0.2f}'.format(
          undersample_average_precision), fontsize=16)
3-6. SMOTE 기법을 적용한 오버샘플링
SMOTE 기법이란 Synthetic Minority Over-sampling TEchnique의 약자로, 클래스의 불균형을 맞추기 위해 인위적으로 부족한 케이스를 만들어내는 것이다.
SMOTE는 부족한 케이스들 중에서 가장 가까이 이웃한 케이스들 간의 거리를 계산(KNN 활용)하고, 그 이웃들 사이에 선을 그어 무작위 점을 생성하는 방식이다.
그 무작위 점이 바로 synthetic point(synthetic sample)이고 무작위 점들을 샘플로 추가해서 오버샘플링이 된다.
SMOTE에서는 이렇게 오버샘플링을 하기 때문에 정보의 손실 없이 좋은 정보들을 유지할 수 있다.
또한, 샘플들 사이의 특성을 반영해서 데이터를 생성하기 때문에 과적합에 나름대로 강한 데이터가 만들어진다.
(하지만, 과적합 문제는 여전히 존재한다.)
그 대신 많은 정보를 이용해서 분석 시간이 더 오래 걸린다는 단점이 있다.
Data Leakage 문제
언더샘플링이나 오버샘플링을 사용했을 때 흔히들 하는 실수가 있는데, 바로 교차검증(CV) 이전에 언더/오버샘플링을 실시하는 것이다.
교차검증 전에 샘플링을 하는 경우 'data leakage'라는 문제가 발생하는데, validation set에 직접적인 영향을 미칠 수 있다는 것을 의미한다.
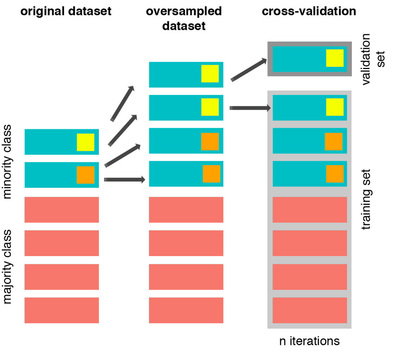
위 그림처럼 오버샘플링으로 생성한 데이터 세트가 검증 세트가 될 수 있고, 검증 데이터는 훈련에 사용되면 안되기 때문에 문제가 발생한다.
이를 방지하기 위해서 CV를 하면서 오버/언더샘플링을 진행해야 하는 것이다.

SMOTE 기법 적용
#SMOTE 기법 적용하기

from imblearn.over_sampling import SMOTE
from sklearn.model_selection import train_test_split, RandomizedSearchCV

print('Length of X (train): {} | Length of y (train): {}'.format(len(original_Xtrain),
                                                                 len(original_ytrain)))
print('Length of X (test): {} | Length of y (test): {}'.format(len(original_Xtest),
                                                                 len(original_ytest)))

#성능 평가

accuracy_lst = []
precision_lst = []
recall_lst = []
f1_lst = []
auc_lst = []

#분류기 별 최적 파라미터 찾기
log_reg_sm = LogisticRegression()

rand_log_reg = RandomizedSearchCV(LogisticRegression(), log_reg_params, n_iter = 4)

#SMOTE 기법 실행 (CV를 진행하면서 동시에 오버샘플링)
#파라미터 정하기
log_reg_params = {"penalty": ['l1', 'l2'], 'C': [0.001, 0.01, 0.1, 1, 10, 100, 1000]}

for train, test in sss.split(original_Xtrain, original_ytrain):
    pipeline = imbalanced_make_pipeline(SMOTE(sampling_strategy = 'minority'), rand_log_reg)
    #CV하면서 SMOTE 적용하기
    model = pipeline.fit(original_Xtrain[train], original_ytrain[train])
    best_est = rand_log_reg.best_estimator_
    prediction = best_est.predict(original_Xtrain[test])

    accuracy_lst.append(pipeline.score(original_Xtrain[test], original_ytrain[test]))
    precision_lst.append(precision_score(original_ytrain[test], prediction))
    recall_lst.append(recall_score(original_ytrain[test], prediction))
    f1_lst.append(f1_score(original_ytrain[test], prediction))
    auc_lst.append(roc_auc_score(original_ytrain[test], prediction))

print('---' * 45)
print('')
print("accuracy: {}".format(np.mean(accuracy_lst)))
print("precision: {}".format(np.mean(precision_lst)))
print("recall: {}".format(np.mean(recall_lst)))
print("f1: {}".format(np.mean(f1_lst)))
print('---' * 45)
이번에도 역시 매우 긴 코딩..

classification_report 함수 사용하기
#classification_report 함수로 점수 확인

labels = ['No Fraud', 'Fraud']
smote_prediction = best_est.predict(original_Xtest)
print(classification_report(original_ytest, smote_prediction, target_names = labels))
정밀도-재현율 점수 계산
#정밀도-재현율 점수

y_score = best_est.decision_function(original_Xtest)

average_precision = average_precision_score(original_ytest, y_score)
print('Average precision-recall score: {0:0.2f}'.format(average_precision))
정밀도-재현율 곡선 그리기
#정밀도-재현율 곡선 그리기

fig = plt.figure(figsize = (12, 6))

precision, recall, _ = precision_recall_curve(original_ytest, y_score)

plt.step(recall, precision, color = 'r', alpha = 0.2, where = 'post')
plt.fill_between(recall, precision, step = 'post', alpha = 0.2, color = '#F59B99')
plt.xlabel('Recall')
plt.ylabel('Precision')
plt.ylim([0.0, 1.05])
plt.xlim([0.0, 1.0])
plt.title('OverSampling Precision-Recall curve: \n Average Precision-Recall Score ={0:0.2f}'.format(
          average_precision), fontsize=16)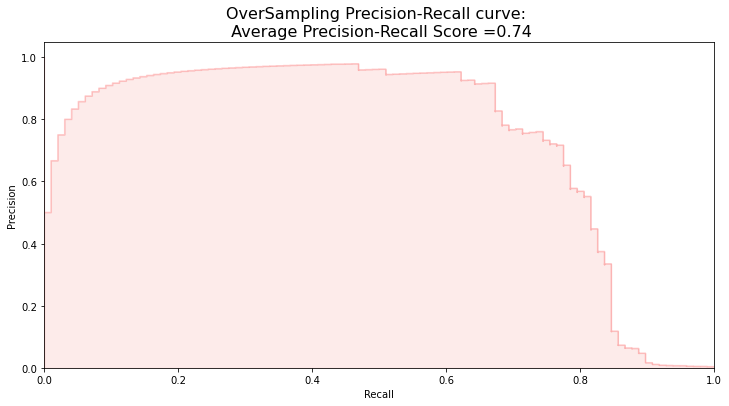
SMOTE 시간 측정
#데이터 분할 후에 SMOTE 기법 적용

sm = SMOTE( random_state = 42)

Xsm_train, ysm_train = sm.fit_sample(original_Xtrain, original_ytrain)

#SMOTE를 적용한 로지스틱 회귀 적합의 시간 측정

t0 = time.time()
log_reg_sm = grid_log_reg.best_estimator_
log_reg_sm.fit(Xsm_train, ysm_train)
t1 = time.time()
print("Fitting oversample data took: {} sec".format(t1 - t0))
4. 검증(Testing)
4-1. 로지스틱 회귀 적용하기
가장 좋은 퍼포먼스를 보인 분류기는 로지스틱회귀와 SVM이었다.
각 분류기의 검증 결과 히트맵으로 그리기
from sklearn.metrics import confusion_matrix

#SMOTE 기법을 적용한 로지스틱 회귀

y_pred_log_reg = log_reg_sm.predict(X_test)

#언더샘플링을 적용한 다른 모델

y_pred_knear = knears_neighbors.predict(X_test)
y_pred_svc = svc.predict(X_test)
y_pred_tree = tree_clf.predict(X_test)

log_reg_cf = confusion_matrix(y_test, y_pred_log_reg)
kneighbors_cf = confusion_matrix(y_test, y_pred_knear)
svc_cf = confusion_matrix(y_test, y_pred_svc)
tree_cf = confusion_matrix(y_test, y_pred_tree)

fig, ax = plt.subplots(2, 2, figsize = (22, 12))

sns.heatmap(log_reg_cf, ax = ax[0][0], annot = True, cmap = plt.cm.copper)
ax[0, 0].set_title("Logistic Regression \n Confusion Matrix", fontsize = 14)
ax[0, 0].set_xticklabels(['', ''], fontsize = 14, rotation = 90)
ax[0, 0].set_yticklabels(['', ''], fontsize = 14, rotation = 360)

sns.heatmap(kneighbors_cf, ax = ax[0][1], annot = True, cmap = plt.cm.copper)
ax[0, 1].set_title("KNearsNeighbors \n Confusion Matrix", fontsize = 14)
ax[0, 1].set_xticklabels(['', ''], fontsize = 14, rotation = 90)
ax[0, 1].set_yticklabels(['', ''], fontsize = 14, rotation = 360)

sns.heatmap(svc_cf, ax = ax[1][0], annot = True, cmap = plt.cm.copper)
ax[1, 0].set_title("Support Vector Classifier \n Confusion Matrix", fontsize = 14)
ax[1, 0].set_xticklabels(['', ''], fontsize = 14, rotation = 90)
ax[1, 0].set_yticklabels(['', ''], fontsize = 14, rotation = 360)

sns.heatmap(log_reg_cf, ax = ax[1][1], annot = True, cmap = plt.cm.copper)
ax[1, 1].set_title("DecisionTree Classifier \n Confusion Matrix", fontsize = 14)
ax[1, 1].set_xticklabels(['', ''], fontsize = 14, rotation = 90)
ax[1, 1].set_yticklabels(['', ''], fontsize = 14, rotation = 360)

plt.show()
classification_report로 성능 점수 확인
#classification_report로 성능 점수 확인

from sklearn.metrics import classification_report


print('Logistic Regression:')
print(classification_report(y_test, y_pred_log_reg))

print('KNears Neighbors:')
print(classification_report(y_test, y_pred_knear))

print('Support Vector Classifier:')
print(classification_report(y_test, y_pred_svc))

print('DecisionTree Classifier:')
print(classification_report(y_test, y_pred_tree))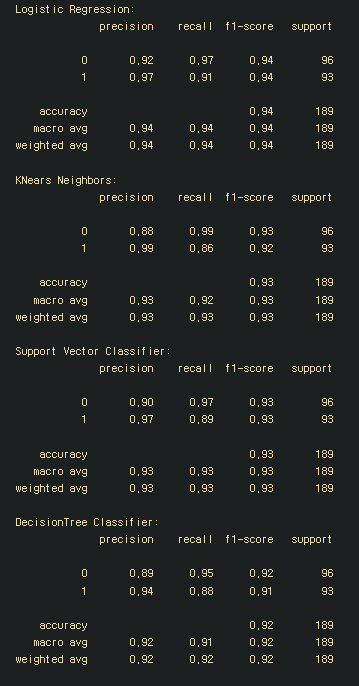
정확도를 쓰면 안되는 이유
#정확도를 쓰면 안되는 이유

from sklearn.metrics import accuracy_score

#언더샘플링을 사용한 로지스틱회귀
y_pred = log_reg.predict(X_test)
undersample_score = accuracy_score(y_test, y_pred)

#SMOTE기법을 사용한 로지스틱 회귀
y_pred_sm = best_est.predict(original_Xtest)
oversample_score = accuracy_score(original_ytest, y_pred_sm)

d = {'Technique': ['Random UnderSampling', 'Oversampling (SMOTE)'],
                   'Score': [undersample_score, oversample_score]}
final_df = pd.DataFrame(data = d)

#칼럼 옮기기

score = final_df['Score']
final_df.drop('Score', axis = 1, inplace = True)
final_df.insert(1, 'Score', score)

#정확도가 얼마나 잘못된 측도인지 눈으로 봐라
final_df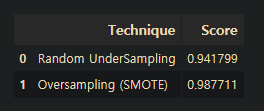
4-2. 신경망 적용 (언더샘플링과 오버샘플링 비교)
마지막 단계에서는 최종적인 결과를 얻기 위해서 언더샘플링한 데이터셋과 오버샘플링한 데이터셋에 적합시킨 모델을 오리지널 검증 데이터에 적용할 것이다.
우리가 가진 데이터셋은 입력층 하나(노드의 개수 = 피처의 개수), 은닉층 하나(노드는 32개)와 출력 노드 두 개(0과 1)로 구성된 간단한 신경망 구조로 표현할 수 있다.
최적화를 위해서 학습률은 0.001, 옵티마이저는 Adam옵티마이저, 활성화 함수로는 ReLU 함수를 사용할 것이고, 최종 출력을 위해서 keras 패키지의 손실함수인 sparse categorical cross entropy(다중 분류 손실함수)를 사용해서 이상거래인지 아닌지를 확률을 계산해 더 높은 확률을 선택하도록 할 것이다.
이를 적용하기 위해서는 keras 패키지를 받아야한다.
신경망 층 만들어주기
#keras 불러오기

import keras
from keras import backend as K
from keras.models import Sequential
from keras.layers import Activation
from keras.layers.core import Dense
from keras.optimizers import Adam
from keras.metrics import categorical_crossentropy

#신경망 층 만들어주기
n_inputs = X_train.shape[1]

undersample_model = Sequential([
    Dense(n_inputs, input_shape=(n_inputs, ), activation='relu'),
    Dense(32, activation='relu'),
    Dense(2, activation='softmax')
])
undersample_model.summary()
신경망 데이터 적용
#신경망 데이터 적용

undersample_model.compile(Adam(lr = 0.001), loss = 'sparse_categorical_crossentropy',
                          metrics = ['accuracy'])

undersample_model.fit(X_train, y_train, validation_split = 0.2, batch_size = 25, epochs = 20,
                      shuffle = True, verbose = 2)
epoch, batch size와 iteration의 의미를 알아야겠다.

epoch: 신경망은 역전파 알고리즘을 사용하여 가중치를 개선하는데, 역전파 알고리즘은 순방향으로 갔다가 역방향으로 한 번 돌아오면서 가중치를 계산하는 것이다. 이 때, 순방향과 역방향이 한 번 진행된 것을 epoch라고 한다.
만약 epoch가 20이라면 전체 데이터로 학습 과정을 20번 진행했다고 생각하면 된다.
이때 만약 epoch 값이 너무 크다면 과적합, 너무 작다면 과소적합이 될 수 있으니 적절한 epoch값을 설정하는 것이 중요하다.
batch size: 학습과정을 한 번 진행할 때(1 epoch), 모든 데이터 셋을 한 번에 집어넣지 않고 batch size로 쪼개서 진행한다.
iteration: 하나의 batch size를 학습하는 과정. 즉 전체 데이터 셋이 100개이고 batch size가 20개라면 iteration은 5가 되는 것이다.
신경망 모델로 예측
#test셋으로 예측

undersample_predictions = undersample_model.predict(original_Xtest, batch_size = 200, verbose = 0)

undersample_fraud_predictions = undersample_model.predict_classes(original_Xtest, batch_size = 200,
                                                                 verbose = 0)
혼동행렬 그리는 함수 만들기
#혼동행렬 그리는 함수 만들기

import itertools

#혼동행렬 만들기

def plot_confusion_matrix(cm, classes, normalize = False, title = 'Confusion Matrix', cmap = plt.cm.Blues):
    if normalize:
        cm = cm.astype('float') / cm.sum(axis = 1)[:, np.newaxis]
        print("Normalized confusion matrix")
    else:
        print('Confusion matrix, without normalization')

    print(cm)

    plt.imshow(cm, interpolation = 'nearest', cmap = cmap)
    plt.title(title, fontsize = 14)
    plt.colorbar()
    tick_marks = np.arange(len(classes))

    fmt = '.2f' if normalize else 'd'
    thresh = cm.max() / 2.
    for i, j, in itertools.product(range(cm.shape[0]), range(cm.shape[1])):
                                  plt.text(j, i, format(cm[i, j], fmt),
                                          horizontalalignment = "center",
                                          color = "white" if cm[i, j] > thresh else "black")
    plt.tight_layout()
    plt.ylabel('True label')
    plt.xlabel('Predicted label')
plot_confusion_matrix라는 함수를 만들어 혼동행렬을 그리도록 한다.
def plot_confusion_matrix(cm, classes, normalize = False, title = 'Confusion Matrix', cmap = plt.cm.Blues):
-> 그 함수에 쓰이는 파라미터는 cm(혼동행렬), classes, normalize, title, cmap 총 다섯가지.
먼저 normalize를 판단해서 normalize가 True라면( if normalize: ), 새로운 혼동행렬을 계산해서 ( cm = cm.astype('float') / cm. sum(axis = 1)[:, np.newaxis] )
normalized confusion matrix라고 출력하고, ( print('Normalized confusion matrix') ),
아니라면 그냥 confusion matrix, without normalizaion을 출력한다. ( print('confusion matrix~~ ') )
그렇게 혼동행렬을 출력하고 ( print(cm) )
plt.imshow(cm, interpolation = 'nearest', cmap = cmap)
-> 혼동행렬 이미지를 출력한다.( plt.imshow(cm) ) 이미지 출력 옵션 중에서 interpolation = 'nearest' 를 사용
(interpolation = 'nearset'는 디스플레이 해상도가 이미지 해상도와 같지 않은 경우 픽셀을 보간하지 않고 이미지를 표시한다)
plt.title(title, fontsize = 14)
-> 이미지 타이틀은 함수에서 입력한대로
plt.colorbar()
-> 이미지 영역에 컬러바를 포함해서 그린다.
tick_marks = np.arange(len(classes))
-> 클래스의 길이만큼의 array를 만든다.
plt.xticks(tic_marks, classes, rotation = 45)
-> x축의 간격 설정
fmt = '.2f' if normalize else 'd'
-> 표시할 숫자의 형식을 말하는 듯
thresh = cm.max() /2.
-> 혼동행렬 중 가장 큰 값의 절반을 thresh로 저장
for i, j in itertools.product(range(cm.shape[0]), range(cm.shape[1])):
-> itertools는 효율적인 루핑(반복)을 위해 사용하는 함수라고 한다. itertools 뒤에 붙는 이터레이터라고 하는 것이 중요하다.
이터레이터 중에서 product 즉, itertools.product(a, b)는 a와 b를 카테시안 곱하는 것이다.
위 함수에서 인자는 혼동행렬의 shape은 (2, 2)이므로 카테시안곱의 결과는.. 각각의 range는 0-2이고 이를 카테시안 곱하면 아마도 00 01 02 10 11 12 20 21 22 가 될 것이다. 그리고 i와 j는 각 반복에 해당하는 숫자가 될 것이다. (잘 모르겠음)
plt.text(j, i, format(cm[i, j], fmt), horizontalalignment = 'center', color = 'white' if cm[i, j] > thresh else 'black')
-> plt.text()로 혼동행렬 그린 것 위에 텍스트를 입힐 것인데,
대충 보니까 horizontalalignmetn = 'center'로 각 칸의 중앙에 텍스트가 위치하게 하는 것 같고,
뒤에 color = ~ 는 텍스트 색이 안 보일까봐 세세하게 배려한 것 같다.
이 역시 시각화를 위해 중요한 부분이지만 공부는 생략한다. 왜냐면 좀 복잡해서..
혼동행렬 그리기
#혼동행렬 그리기

undersample_cm = confusion_matrix(original_ytest, undersample_fraud_predictions)
actual_cm = confusion_matrix(original_ytest, original_ytest)
label = ['No Fraud', 'Fraud']

fig = plt.figure(figsize = (16, 8))

fig.add_subplot(221)
plot_confusion_matrix(undersample_cm, labels, title = "Random Undersample \n Confusion Matrix",
                     cmap = plt.cm.Reds)

fig.add_subplot(222)
plot_confusion_matrix(actual_cm, labels, title = "Confusion Matrix \n (with 100% accuracy)",
                     cmap = plt.cm.Greens)
위에서 만든 혼동행렬 그리기 함수로 혼동행렬을 그렸다.

신경망 오버샘플링 데이터에 적용
#keras 오버샘플링

n_inputs = Xsm_train.shape[1]

oversample_model = Sequential([Dense(n_inputs, input_shape = (n_inputs,), activation = 'relu'),
                              Dense(32, activation = 'relu'),
                              Dense(2, activation = 'softmax')])

oversample_model.compile(Adam(lr = 0.001), loss = 'sparse_categorical_crossentropy',
                         metrics = ['accuracy'])

oversample_model.fit(Xsm_train, ysm_train, validation_split = 0.2, batch_size = 300, epochs = 20,
                    shuffle = True, verbose = 2)
오버샘플링 데이터를 신경망에 적합시켰다.
오버샘플링 데이터로 예측하고 혼동행렬 그리기
#오버샘플링 데이터로 예측

oversample_predictions = oversample_model.predict(original_Xtest, batch_size = 200, verbose = 0)

oversample_fraud_predictions = oversample_model.predict_classes(original_Xtest, batch_size = 200,
                                                                verbose = 0)

oversample_smote = confusion_matrix(original_ytest, oversample_fraud_predictions)
acutal_cm = confusion_matrix(original_ytest, original_ytest)
labels = ['No Fraud', 'Fraud']

fig = plt.figure(figsize = (16, 8))

fig.add_subplot(221)
plot_confusion_matrix(oversample_smote, labels, title = 'OverSample (SMOTE) \n Confusion Matrix',
                     cmap = plt.cm.Oranges)

fig.add_subplot(222)
plot_confusion_matrix(actual_cm, labels, title = 'Confusion Matrix \n (with 100% accuracy)',
                     cmap = plt.cm.Greens)
5. 결론
불균형 데이터에는 SMOTE를 적용하는 것이 효과가 뛰어났다.
캐글러에 따르면 신경망에 오버샘플링 데이터셋을 적용한 것이 언더샘플링을 적용했을 때보다 더 예측이 안 좋을 때가 있다고 한다.
또한 캐글러는 이상치를 제거하는 것은 언더샘플링의 경우에만 적용하는 것이 옳고 오버샘플링에서는 적용해서는 안된다고 말한다.
그리고 지금 공부한 내용은 정확도를 높이기보다는 분류를 제대로 할 수 있는지 확인하는 차원이었다고 하니 더 좋은 성능의 모델을 만들기 위해서는 다른 공부가 필요할 것이다.
'언어 > Python' 카테고리의 다른 글
| 11/14 문제는 문제고 실행은 실행이다 (0) | 2022.11.14 |
|---|---|
| 11/13 배운점보다 의문점 (가상환경 경로 문제 어떡하지..) (0) | 2022.11.13 |
| [kaggle] Credit Card Fraud Detection 코드 보고 연습 (1) (0) | 2020.12.18 |
| [Python] 파이썬에 tensorflow 설치하기 (매우 간단) (0) | 2020.12.16 |
| [Python] imblearn 패키지 설치 (매우 간단) (0) | 2020.12.16 |

